Caffeine optimization
My IB Extended Essay. A model of caffeine, tolerance and sleep, and gradient descent to find the best weekly dose schedule.
The question
If you drink coffee every week, which schedule gives the most productivity over a month? More caffeine helps now. It also builds tolerance and damages sleep, and both of them cost productivity later.
This was my IB Extended Essay. I wrote the model as a differentiable program and let gradient descent find the schedule.
The model
The variables are a weekly schedule of doses. There is one dose slot every 4 hours, so a week has 42 slots. The model repeats the week for 28 days and simulates it in steps of 5 minutes. Thus a schedule that works for one day but builds tolerance over a month gets a low score.
Concentration. One dose gives a blood concentration that rises and then decays:
Doses are relative to 160 mg. The concentrations of all doses add up. A weight matrix holds the contribution of each weekly slot to each 5-minute step of the month. I calculate it once. Each training step is then one matrix-vector product:
Tolerance. Tolerance follows the concentration with a first-order equation. I step it forward with the Euler method and clamp it to :
Effect. The effect saturates at high concentration, and tolerance reduces it:
Base productivity. A daily sine wave, lower in the morning and higher in the evening:
Sleep deprivation. A second state changes only during sleep hours. If the caffeine effect during sleep is above a threshold, the deprivation increases. If it is below the threshold, the deprivation decreases back to the rested value of 1. A sigmoid makes this step differentiable.
Reward. Productivity, divided by the sleep deprivation, times the caffeine effect:
Optimization
The 42 doses are an nn.Parameter in PyTorch. The loss is . Adam changes the doses for 600 epochs, and the doses are clamped at zero.
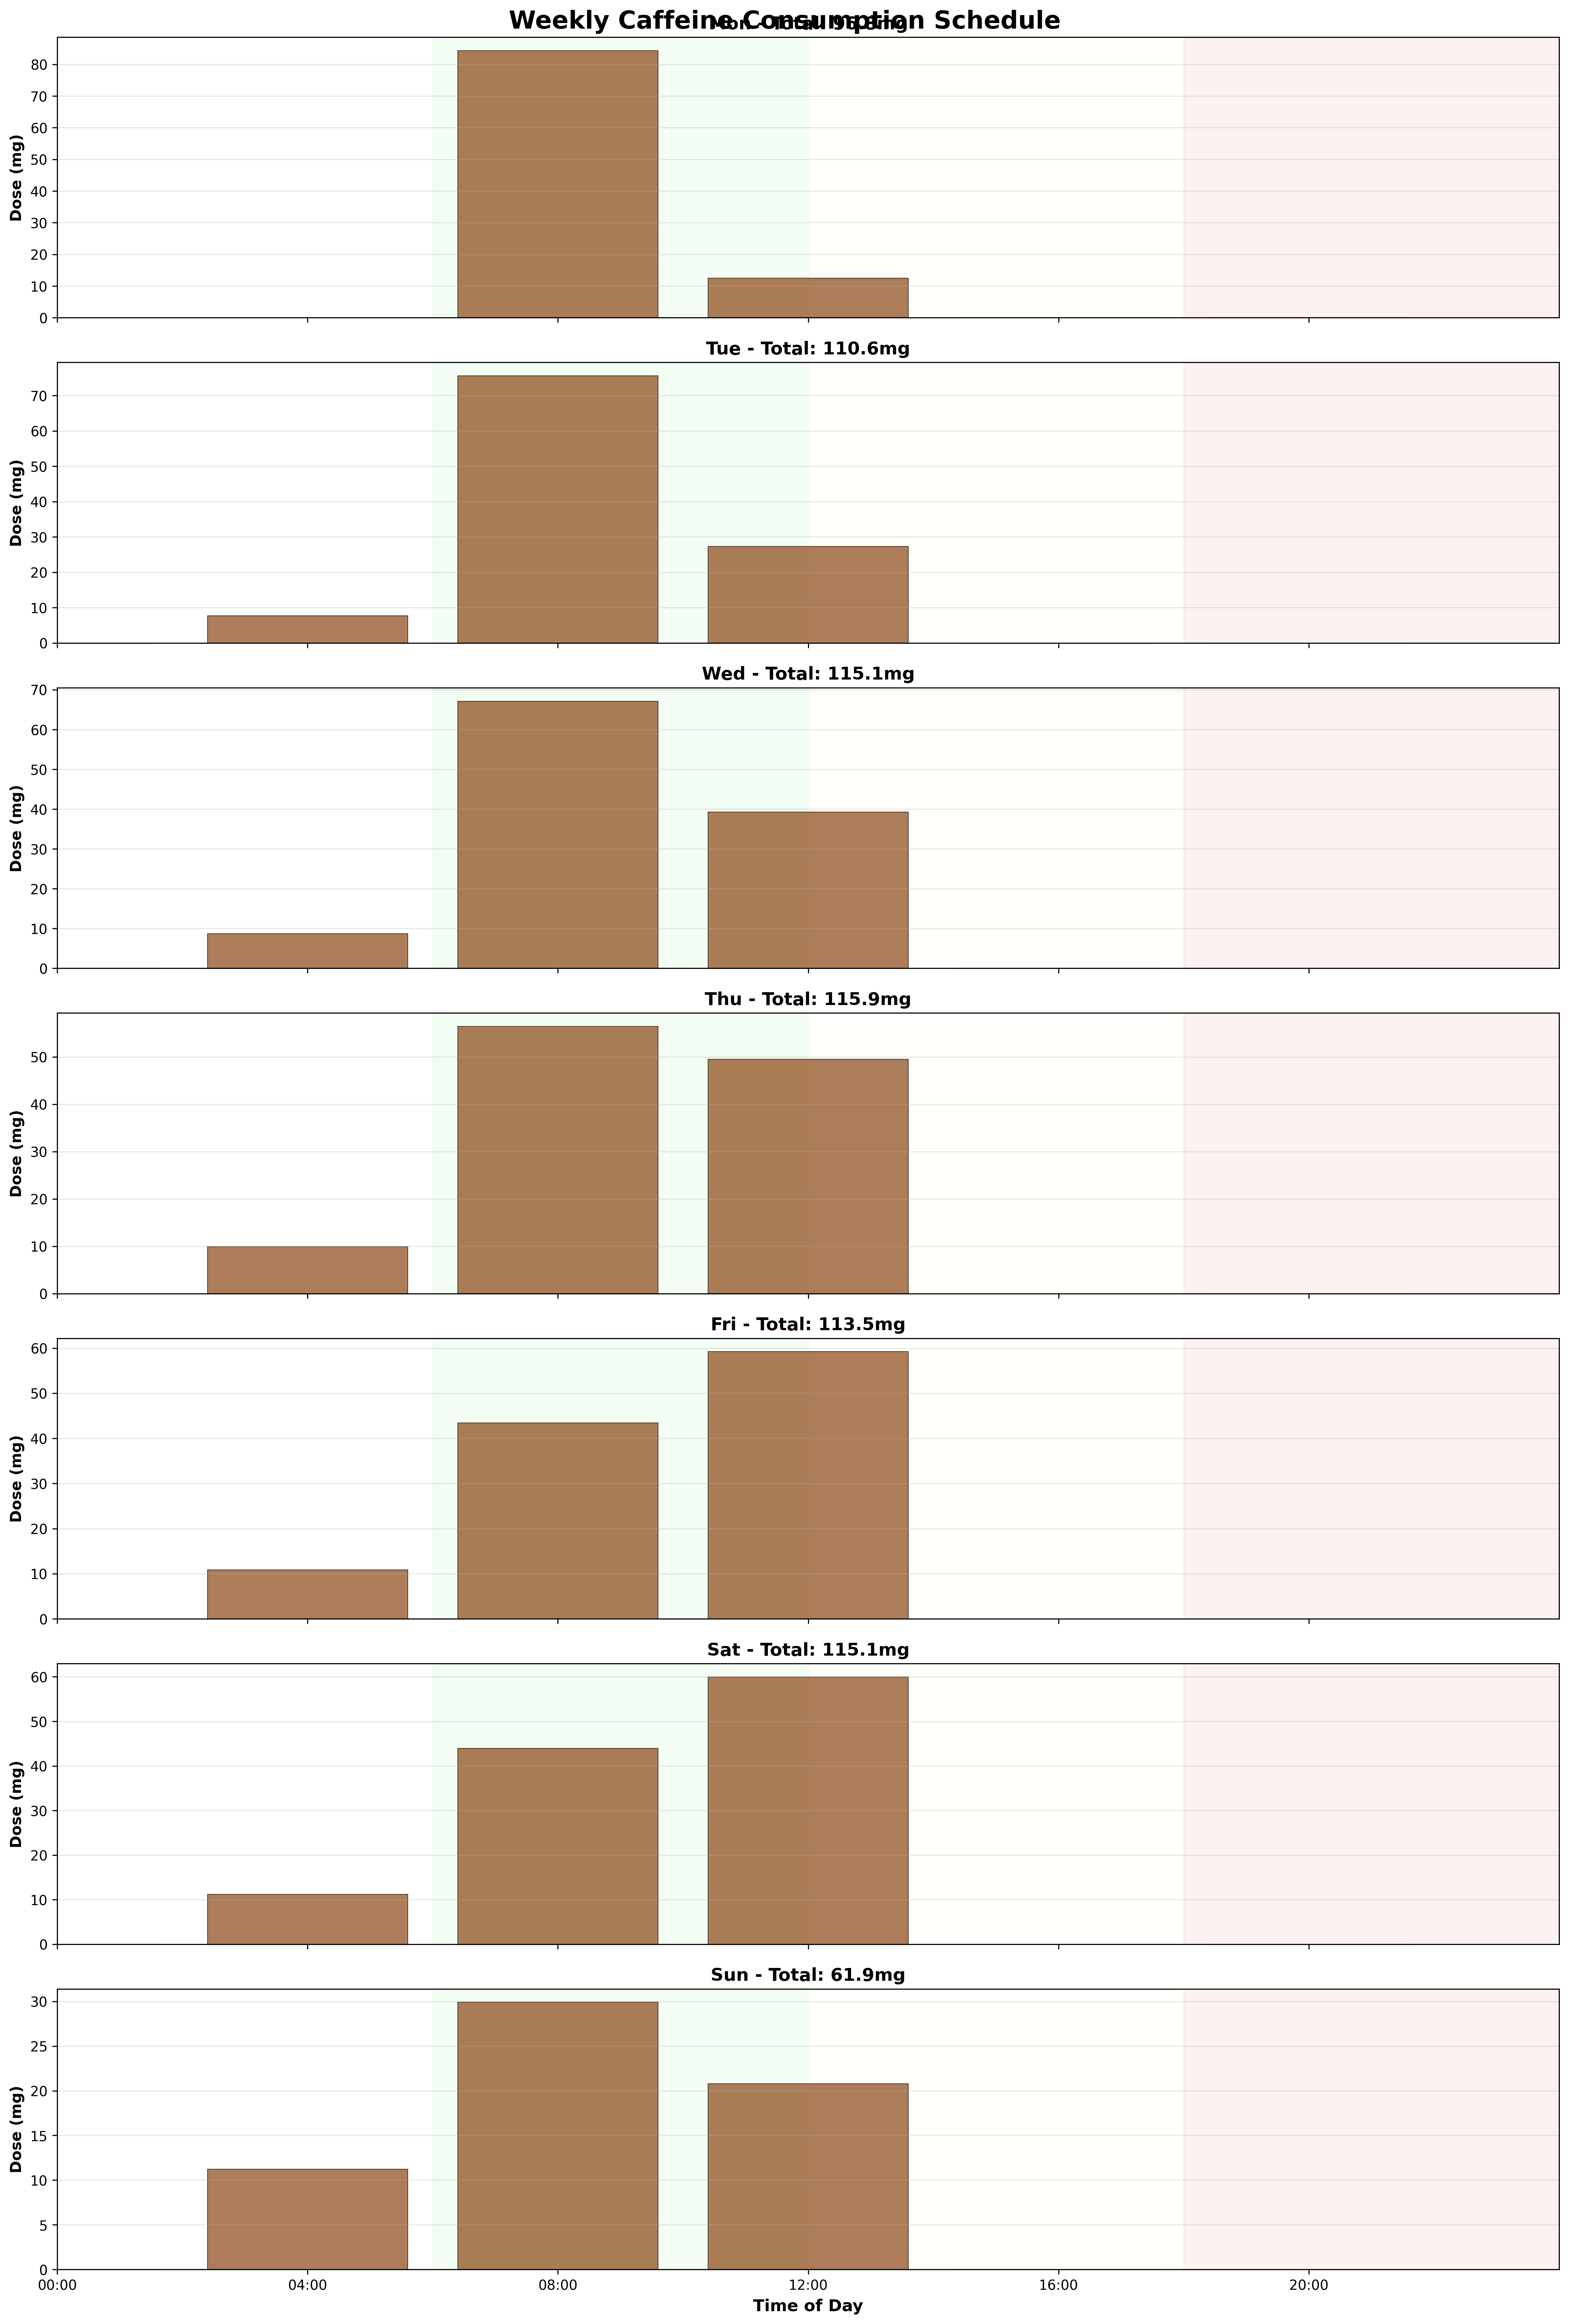
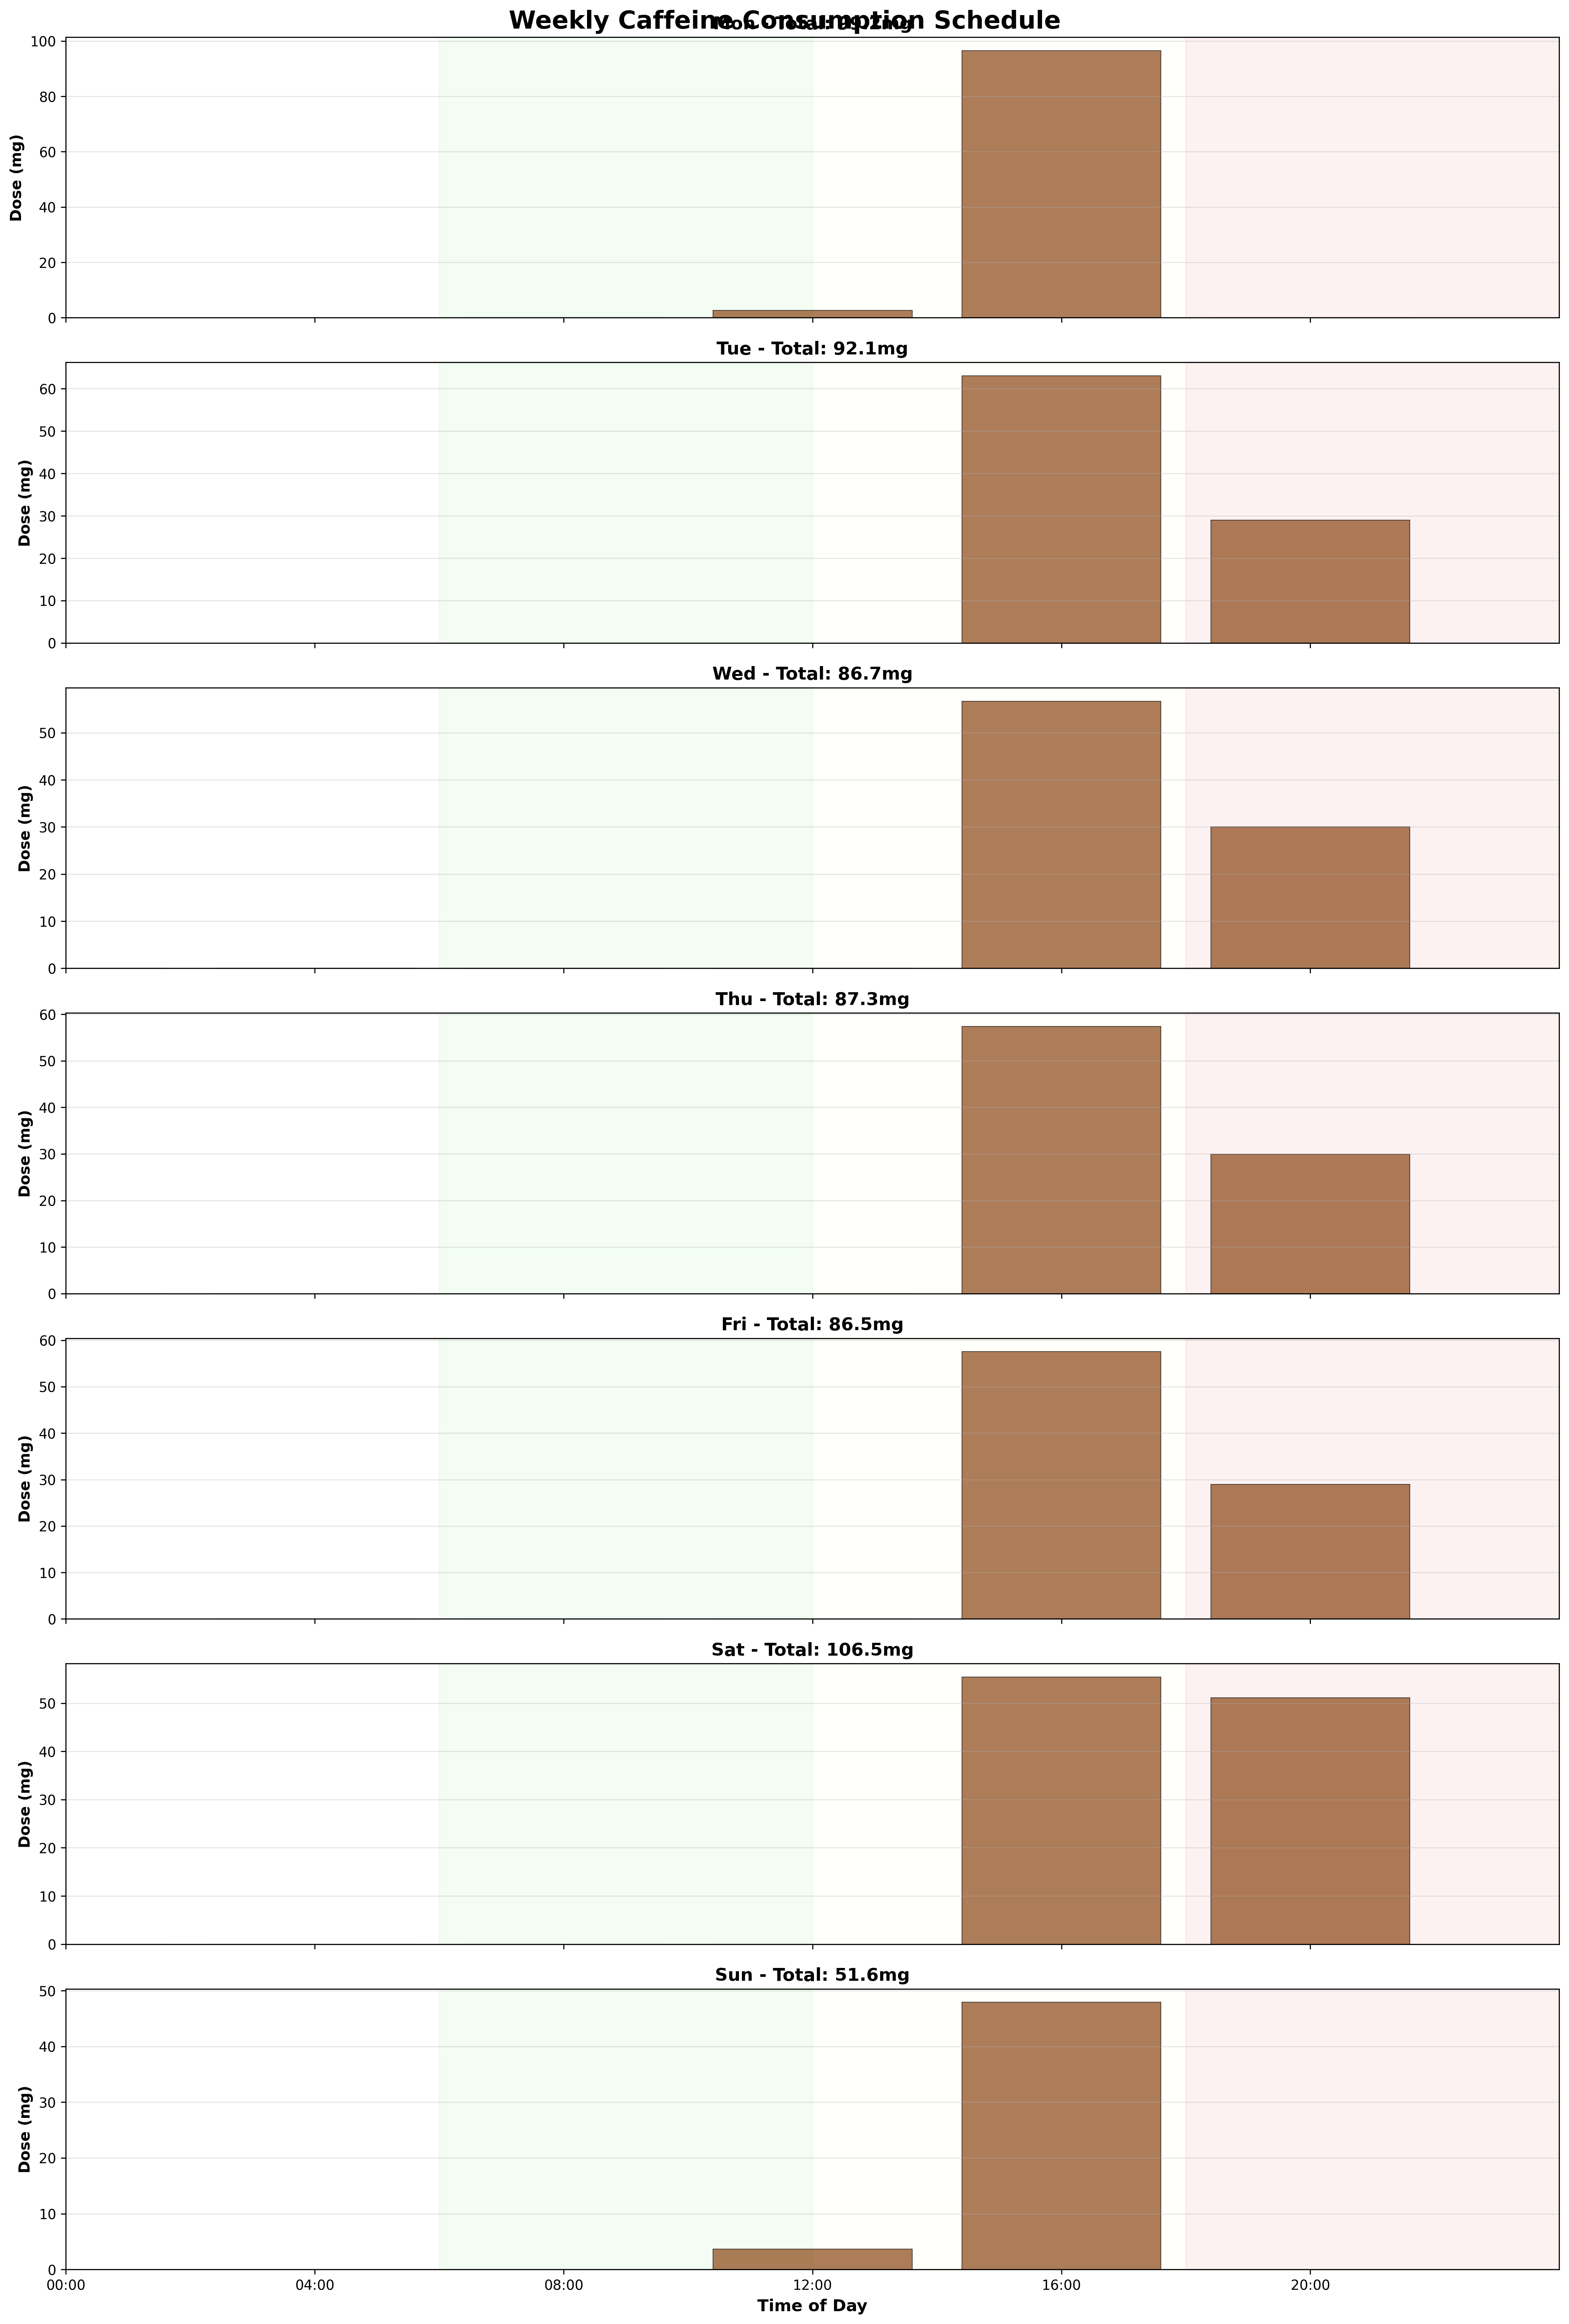
A single dose can reduce productivity much later, through the sleep state. Gradient descent finds these effects without special rules.
The study
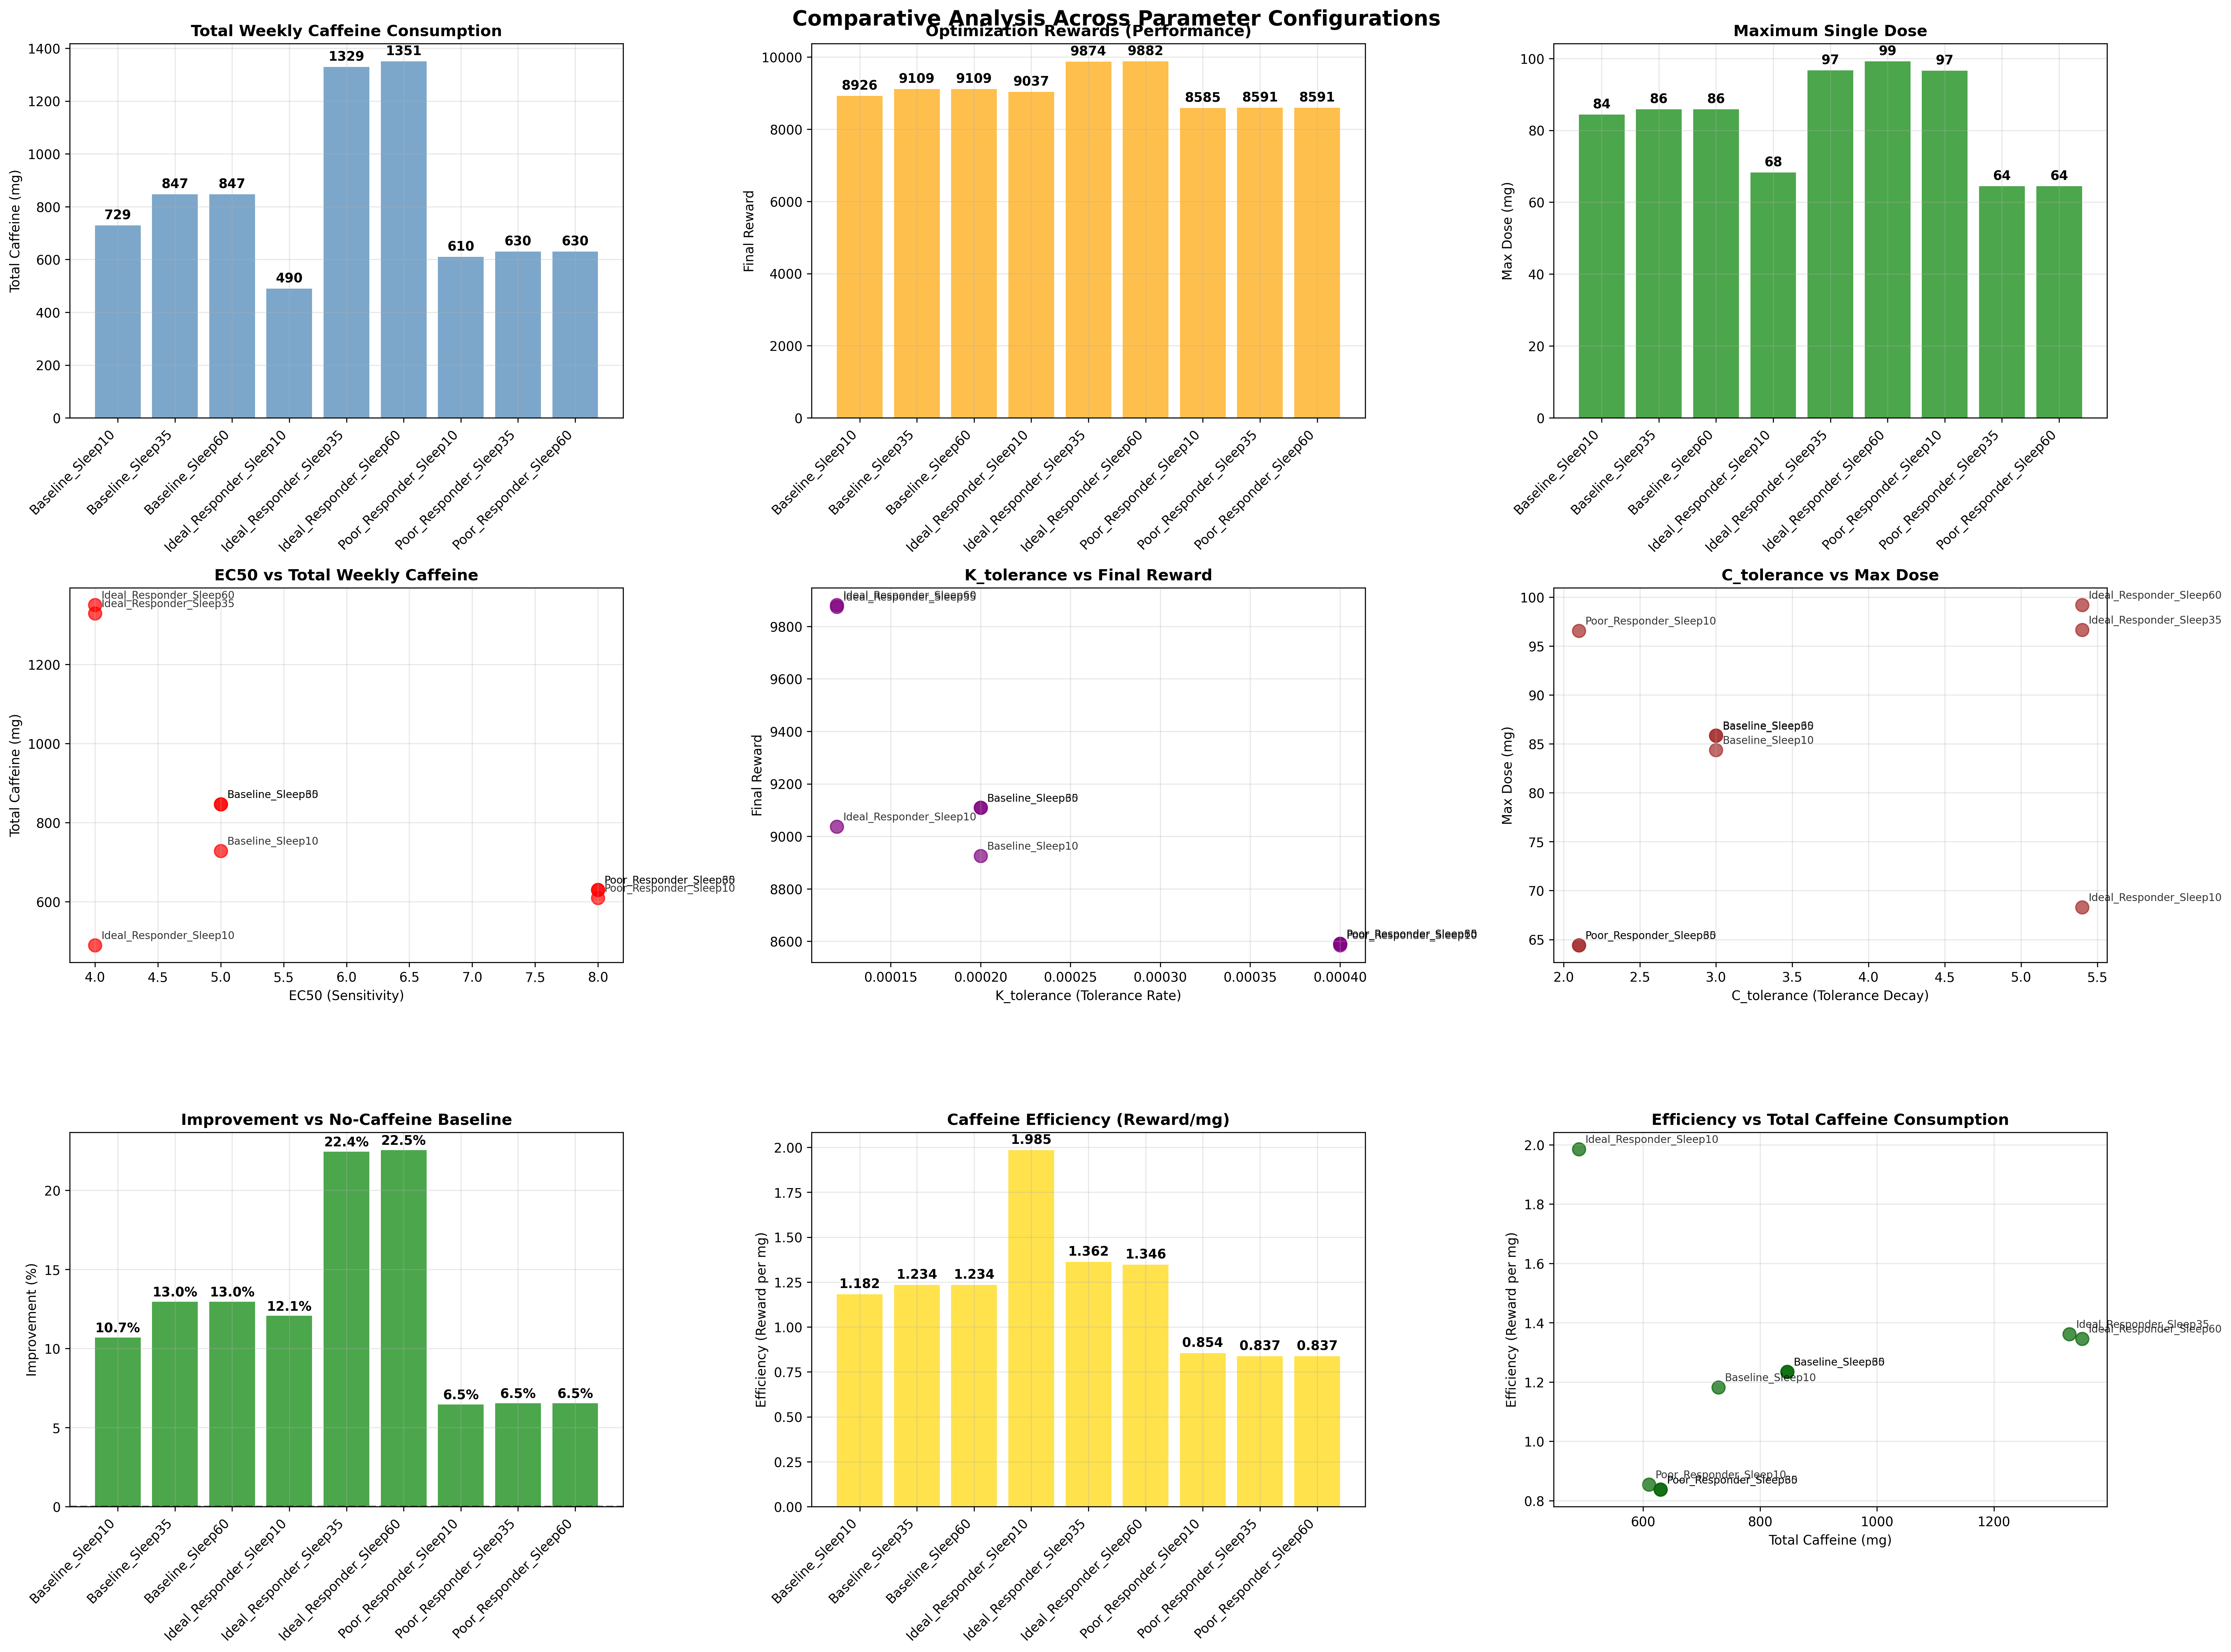
I ran 9 configurations. There are 3 responder profiles ( = 4, 5 and 8, with their own tolerance parameters) and 3 sleep thresholds (0.10, 0.35 and 0.60). Each run also has a baseline without caffeine for comparison.
Limits
The result depends on the parameters. The 9 configurations show how much the best schedule changes when the parameters change. The result is a method, not medical advice.